
Natural Family Planning: How To Chart Your Cycle
Charting Your Cycle can be helpful in both preventing pregnancy and getting pregnant. There are many different types of birth control and multiple herbs, oils and substances which have been used to help prevent unwanted pregnancies all throughout time. However, if you want to postpone getting pregnant naturally, the best way to accomplish this is to understand how your body works and learn to recognize the signs, so that at any given time, you will know where you are in your cycle and what your body is doing. With this knowledge, you can either avoid your fertile time or you can use it to become pregnant when you are ready to have another child.
Throughout your cycle, your body is making adjustments and changing. As you learn to recognize and chart these changes, you will learn how to work with your body. Taking Charge of Your Fertility is one of the most comprehensive books I have ever read on this topic. Toni teaches you how to track your basal temperature, recognize the changes in your vaginal fluid and shows you how the cervix changes depending on what part of your cycle you are in. Tracking just one of these changes is not completely reliable, but when you put all of them together, you will have an accurate account of what is going on in your body.
Depending on how old you are and how healthy you are will determine how long your fertile time is each month. In your teens and up into your twenties, this could last up to three days. As you get older, it will start decreasing until it may only be hours. However, you also need to take into account that sperm can live in the fertile mucus around the cervix for up to five days. Charting will help you to know when you are safe.
In order to track your waking temperatures, you will need a basal thermometer. This type of thermometer is much more accurate in showing slight variations in body temperature. You could use a digital thermometer if it records in 1/10 degrees.
Let’s look at the “Pregnancy Chart” first. This is the one you will use if you are trying to become pregnant. It is a good idea to get a notebook to keep your charts in, with the current chart being on top. This way you and/or your healthcare professional will be able to look back through several cycles to determine what type of a pattern there has been.
Pregnancy Chart Sample

Family Planning Chart Example
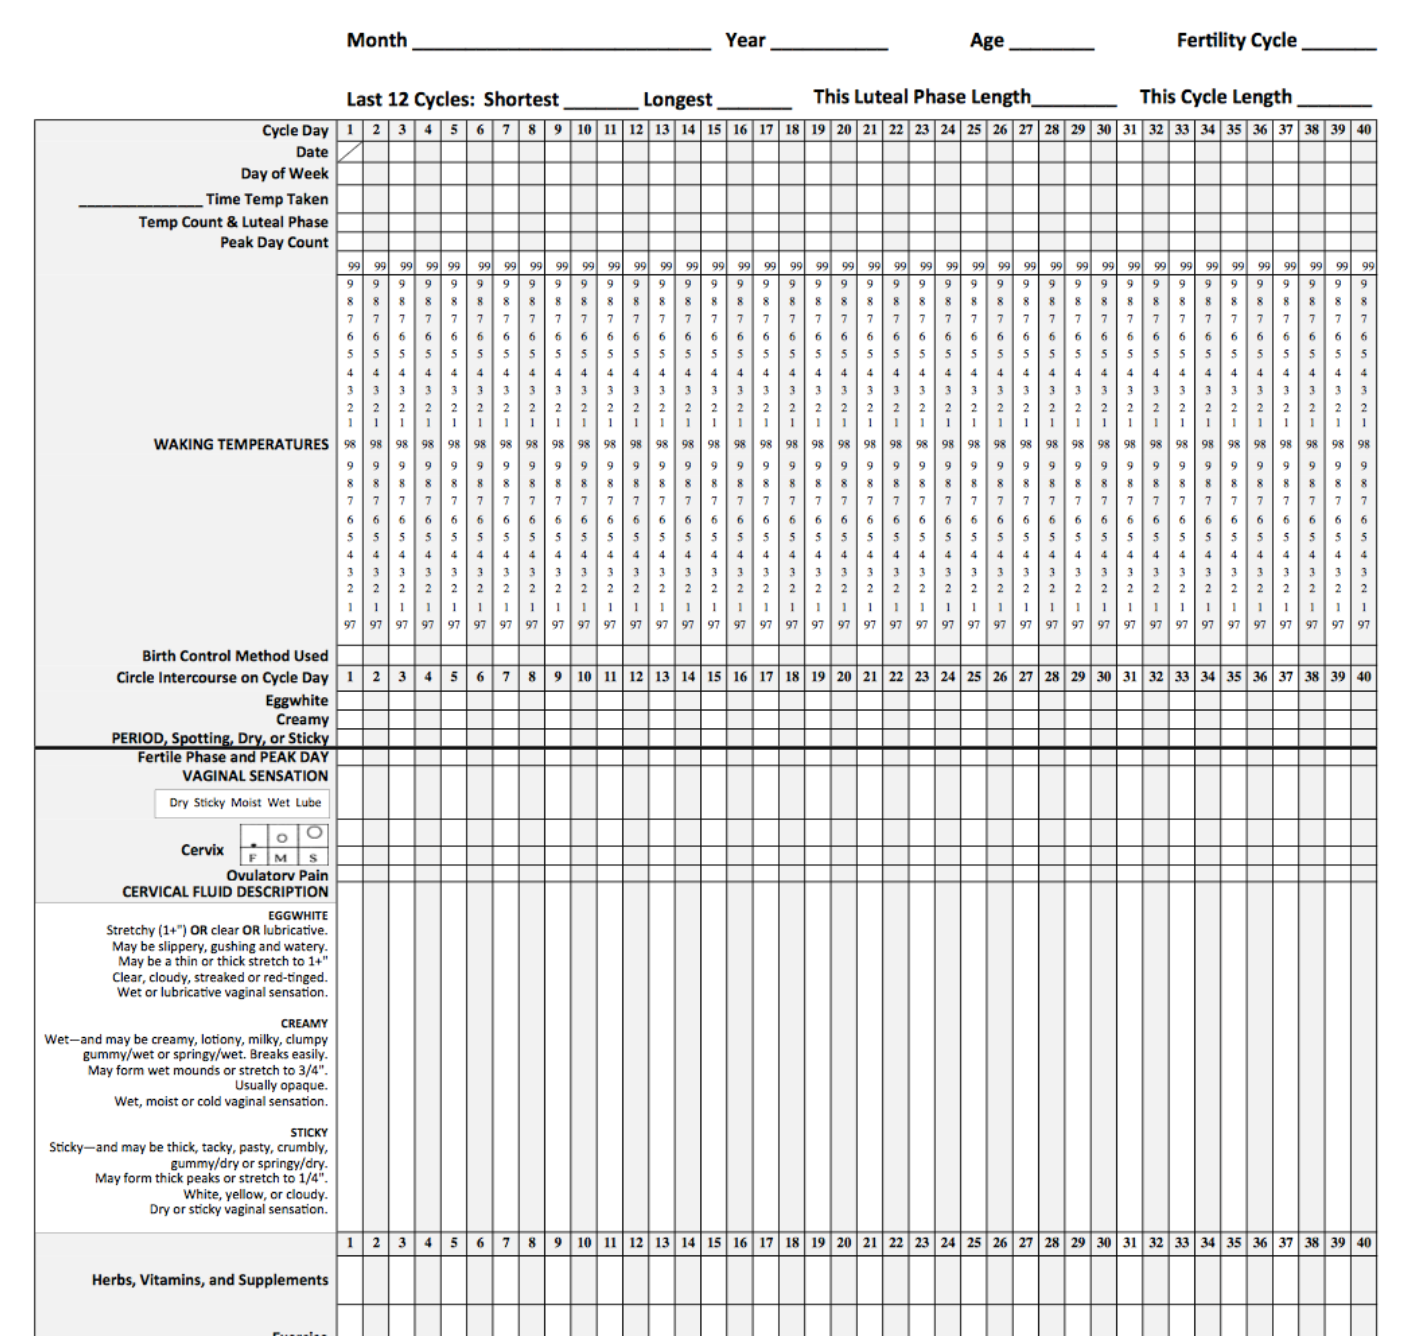
Deciphering the chart
Month: Write in the month you are starting the chart.
Year: Input current year
Age: Your age in years.
Fertility Cycle: If you start charting in the middle of your cycle, place a zero in this spot. If you are starting to chart the first day of your cycle, place a one in this spot. Count each cycle you are charting, so the next cycle would be number two.
The second row wants to know how long your shortest cycle was, what was the longest, how long was this luteal phase and how long was this cycle. If you have never charted before, you will not be able to answer any of these on your first chart.
Cycle Day: The first day of your cycle is the first day of your period, so the first day you see blood is day one.
Date: Put in the date of the day you begin charting.
Day of Week: M = Monday, T=Tuesday, W=Wednesday, R=Thursday, F=Friday, S=Saturday, use a symbol for Sunday such as a dash or star (-*).
Time Temp Taken: You will want to try to take your temperature at the same time every day before you get out of bed. If you normally get up at 7:00 in the morning, then you might want to set an alarm for 6:45. Have your thermometer laying on the bedside table. As soon as you awake, take your temperature and record it.
Record what time you will be taking your temperature to the left of this line. Circle your temperature with the numbers below. Each day connect your circles with a line. This will help you see the pattern much more readily. Your preovulatory waking temps will usually range from about 97.0 to 97.7 degrees Fahrenheit. Postovulatory will usually rise to 97.8 degrees and above. The temperature will typically rise within a day or two after ovulation. That is why tracking just temperature can be deceiving. If you wait for your temperature to rise in order to get pregnant, it will probably be too late.
Temps & Luteal Phase: When your temperature rises as it did on ‘day 17’ for the woman in the chart above, place a number 1 in the square on this line. You are now counting the days to see how long your luteal phase is, so Day 17 is 1, Day 18 would be 2 and so on. The luteal phase is typically about 12 to 16 days. If this phase is shorter than 10 days, it could mean the lining is coming off of the uterine wall before a fertilized egg has a chance to securely implant.
Peak Day: Your peak day is determined by your vaginal fluid. This is considered the last day that you have either a lubricative vaginal sensation or produce a wet, fertile-quality cervical fluid during any given cycle. It usually occurs a day or two before ovulation or on the day you ovulate. This is considered to be your most fertile day. This can only be determined in retrospect on the following day because you will only be able to recognize it after your cervical fluid and vaginal sensation have already dried up. There is usually a pretty dramatic change as the vaginal fluid dries up in response to the rising progesterone. When you note the peak day, put a PK in the correct box.
Waking Temperatures: This is the area where you are circling your basal temperature each morning.
Pregnancy Test: If you have taken a pregnancy test during this cycle, mark either a positive ‘+’ or negative ‘-‘ in this box.
Artificial Insemination or IVF: If you are working with a fertility doctor and are using some type of in vitro fertilization, then mark the day it is done in this box.
Circle Intercourse on Cycle Day: Circle the days you have intimate relations with your partner. This will help you determine whether or not you have come close to your most fertile time. If your luteal phase is long enough and you are consistently having intercourse during your peak days over a period of months, then there may be a problem of low sperm count.
The bottom part of the chart is for recording personal notes on tests, treatments or supplements you may be using. The Family Planning Chart is the same as the Pregnancy Chart except that it includes a place to record any type of birth control methods you may be using. There is so much more information relating to charting your cycle. Find out more through the book I mentioned above via tcoyf.com!